Analytics · Forecasting
Revenue Forecast Model
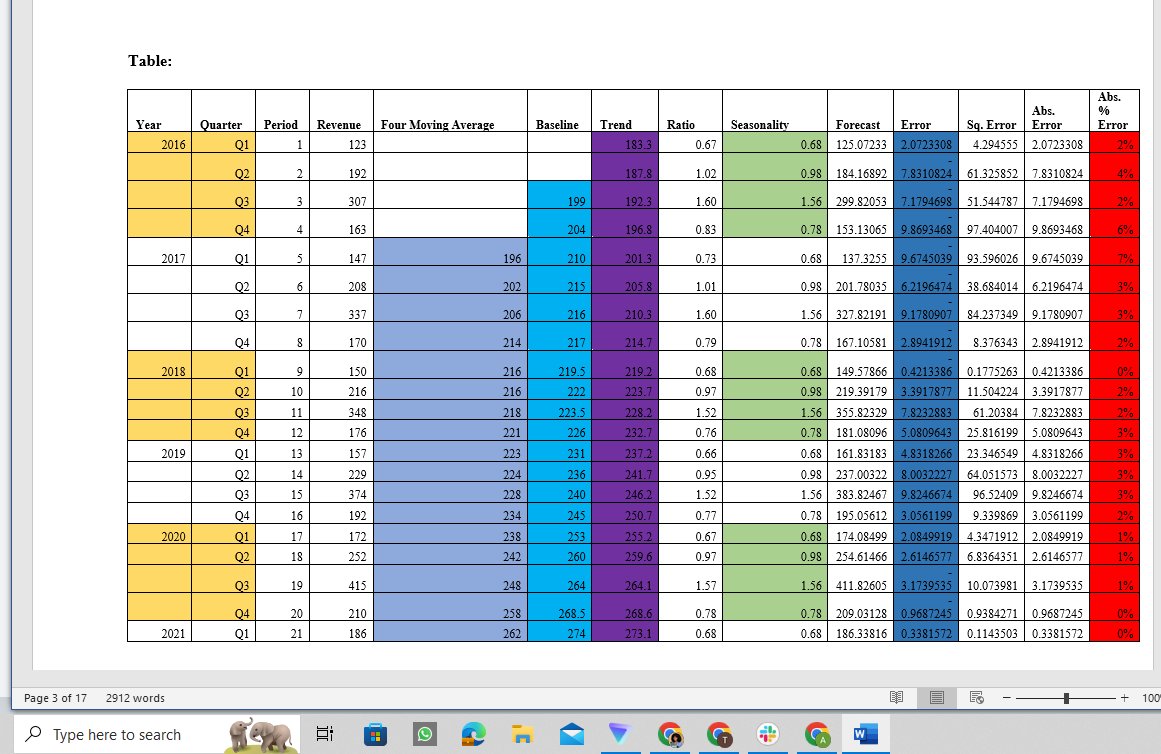
A client running multi-year quarterly revenue wanted to know what next quarter actually looked like — and to stop arguing about it in planning meetings. I built a forecast model that decomposes revenue into trend, seasonality, and error, with measurable accuracy.
Six years of quarterly revenue · trend × seasonality × error decomposition
How the model works
- Four-quarter moving averageSmooths short-term noise to reveal the underlying trend.
- Baseline & trendCentered moving average baseline, with a least-squares trend line fitted across the full period.
- Seasonality indexRatio of actual to baseline per quarter, averaged across years — Q3 is consistently 1.56×, Q4 0.78×, etc.
- ForecastTrend × seasonality, projected forward — with each projected period showing its decomposed contribution.
- Error analysisSquared error, absolute error, and absolute percentage error per period — so the team can see when the model misses and why.
Outcome
Planning conversations shifted from "what do you think Q4 will be" to "what would we need to believe to beat the forecast by 10%?" That's a much better conversation.
The toolchain
Microsoft ExcelPower Query
Outcome
<3%
Average error
Across most quarters.
6 yrs
Historical data
Anchoring the projection.
Quarterly
Refresh cycle
Updated with notes on changed assumptions.