Social Performance Growth — 700K Impressions
A brand had inconsistent posting, no analytics rhythm, and engagement leaking out of a noisy inbox. I came in as the operations layer behind the content team. Over a quarter, monthly impressions grew from 50K to 700K. Here are the receipts.
Peak month · 700.7K impressions · 489% growth
The starting point
Inconsistent posting, no analytics rhythm, and a noisy inbox swallowing engagement. The content was actually good. The operations around it were the bottleneck.
What the operations layer did
- Content calendar & cadenceMoved from sporadic posting to a fixed weekly cadence — same days, same time, same content type rhythm.
- Engagement triageComments and DMs sorted and responded to within a defined SLA — no more "we saw your message three weeks ago" moments.
- Analytics rollupA weekly performance brief comparing this week to last, with the three best-performing posts pulled out for the content team.
- Hashtag & format experimentationTracked which formats (carousels, reels, single-image) were earning attention per audience segment.
- Cross-platform consistencySame content, platform-tuned versions, posted in sync rather than ad-hoc.
The numbers
Across consecutive months, every metric trended sharply up. The brand wasn't getting "lucky" — the operations layer was compounding small wins week after week.
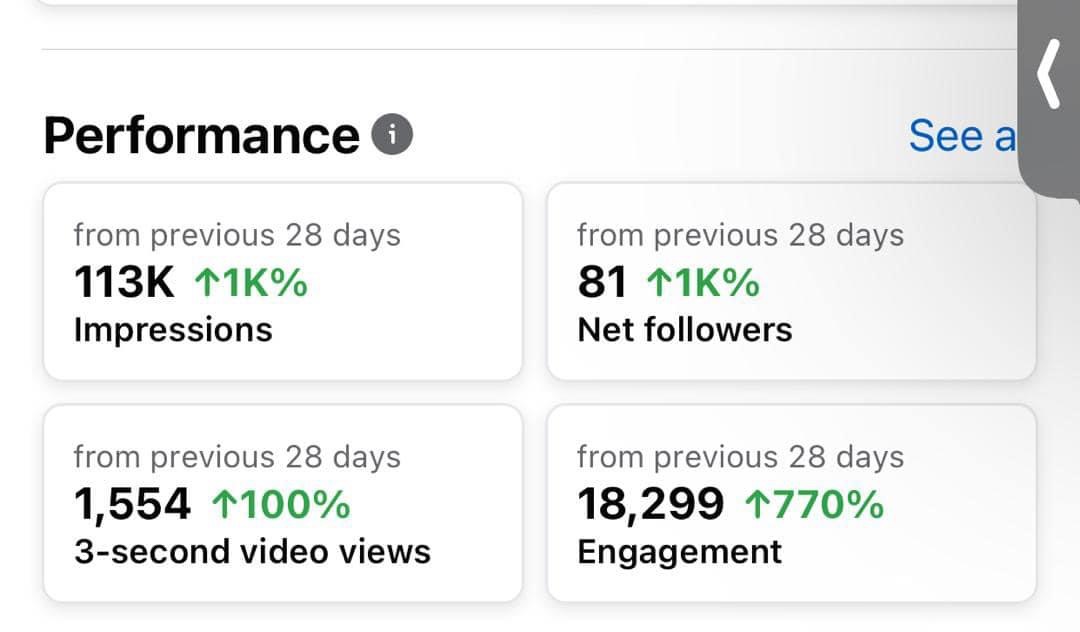
Sustained growth · 113K impressions month
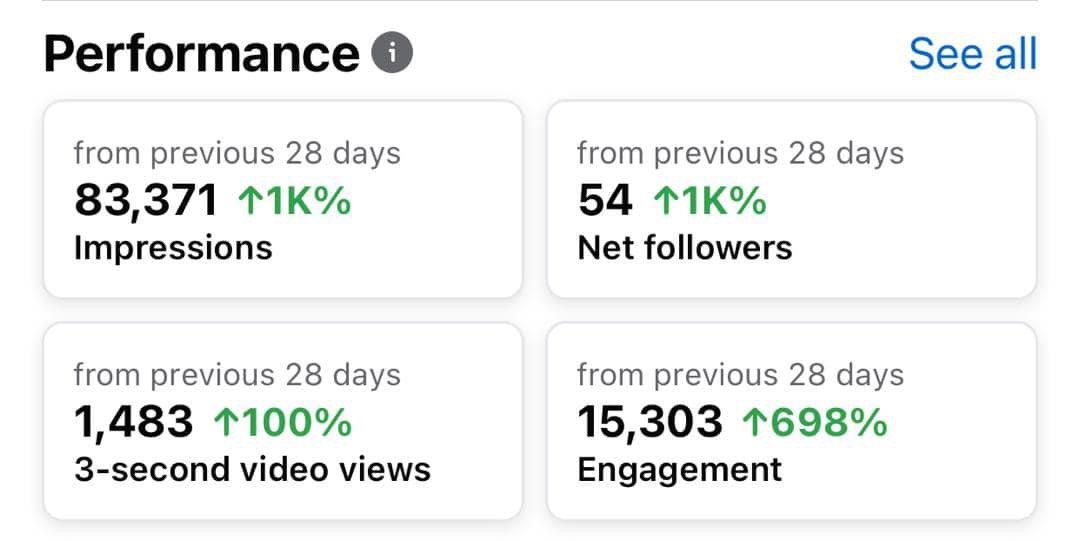
83K impressions · 1K%+ growth across metrics
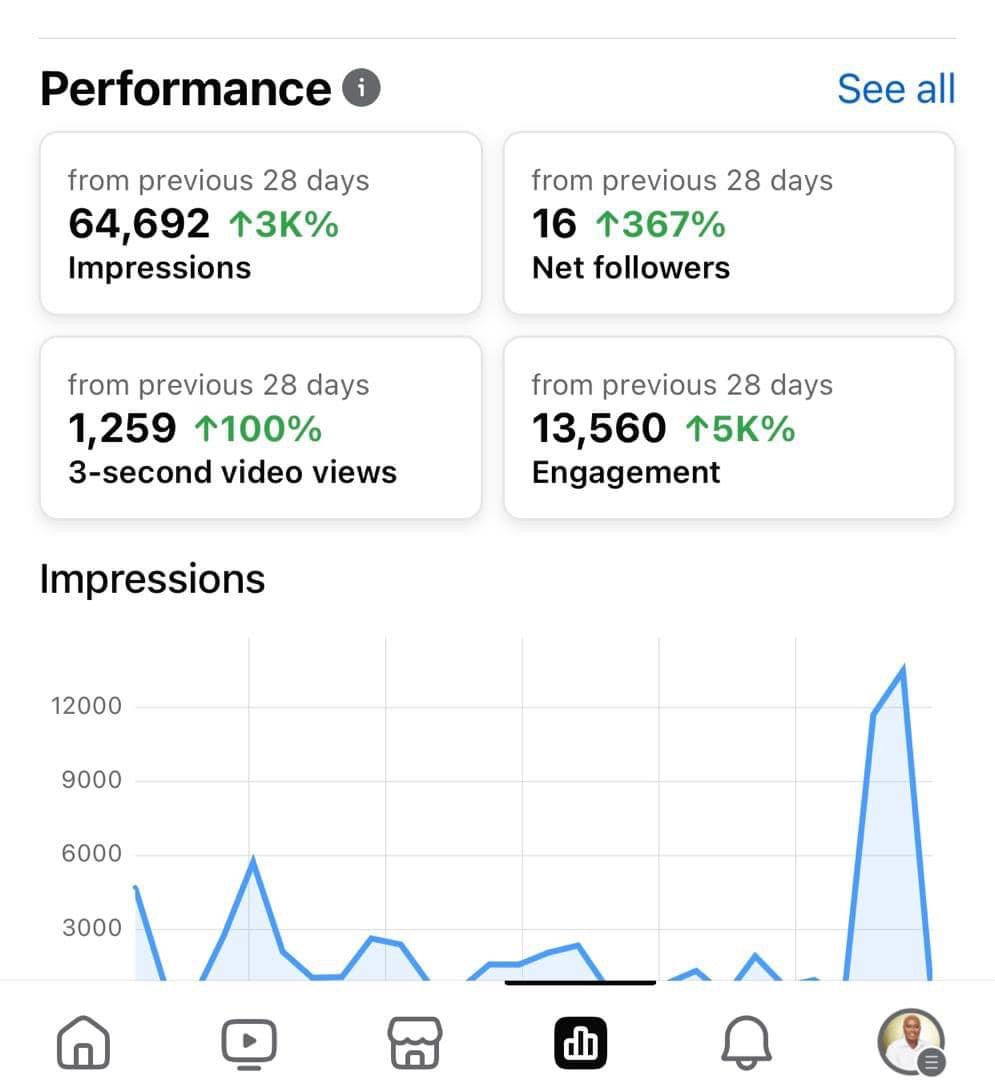
64K impression month with engagement at 5K%+
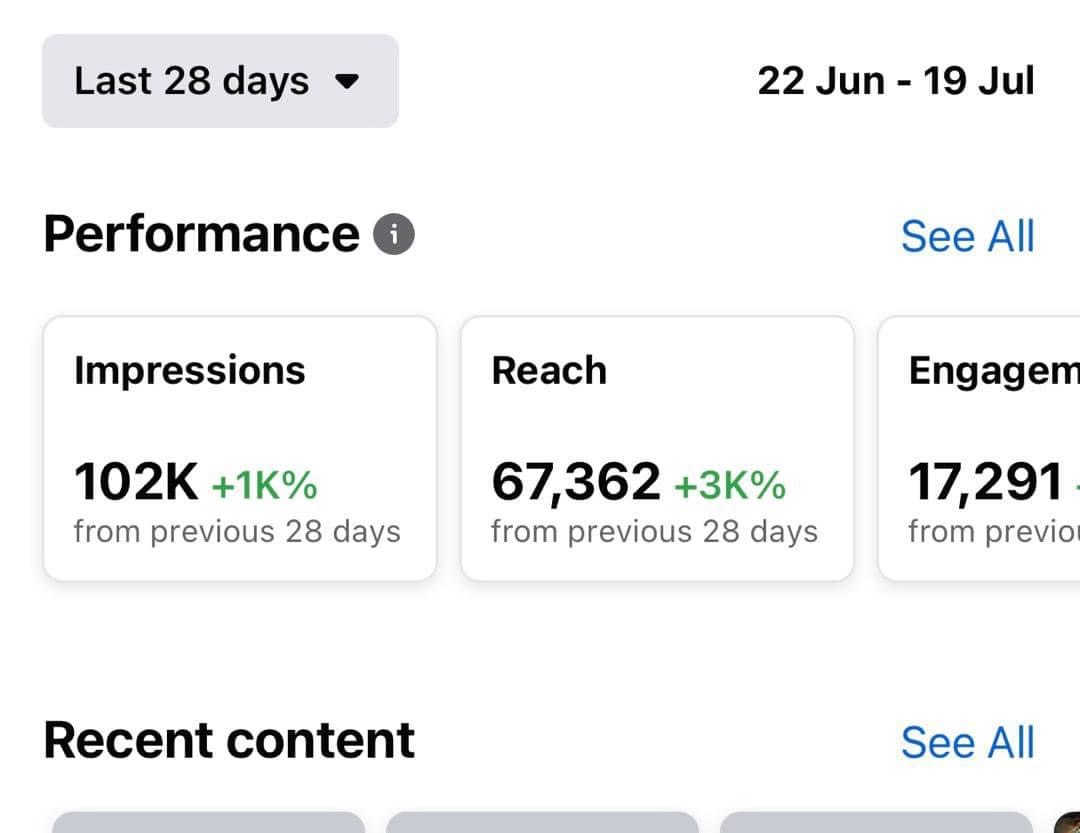
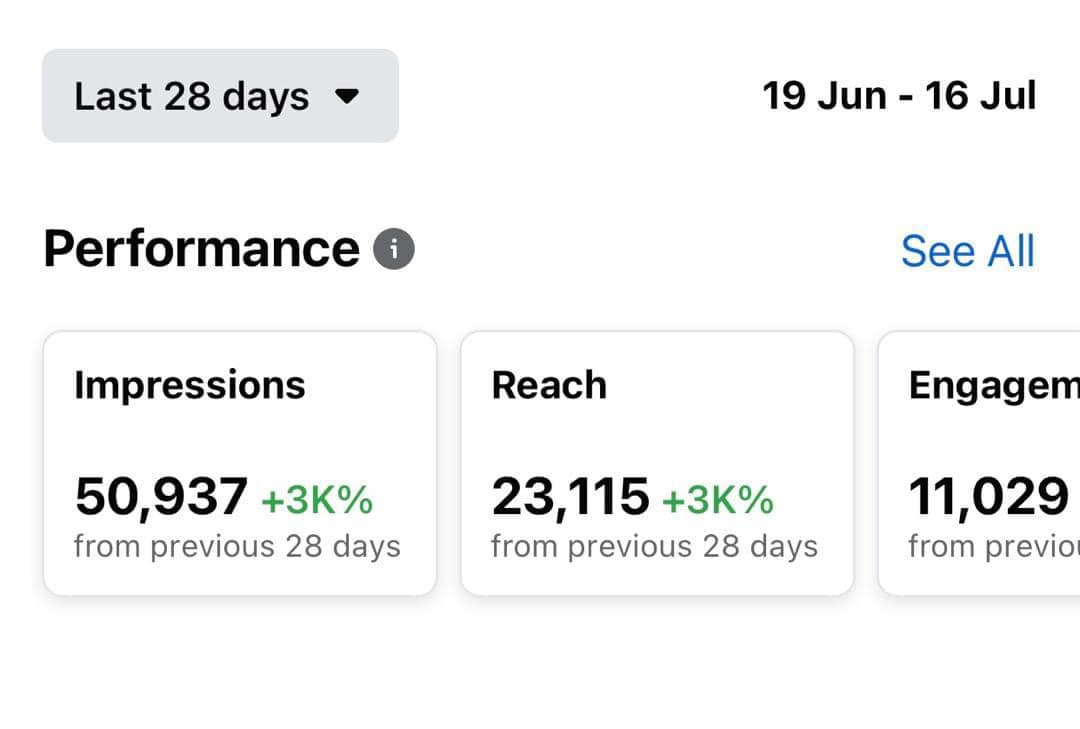
102K reach period · the curve sustained